
Bioinformatics Solutions on AWS Book - Preview
Apr 17, 2021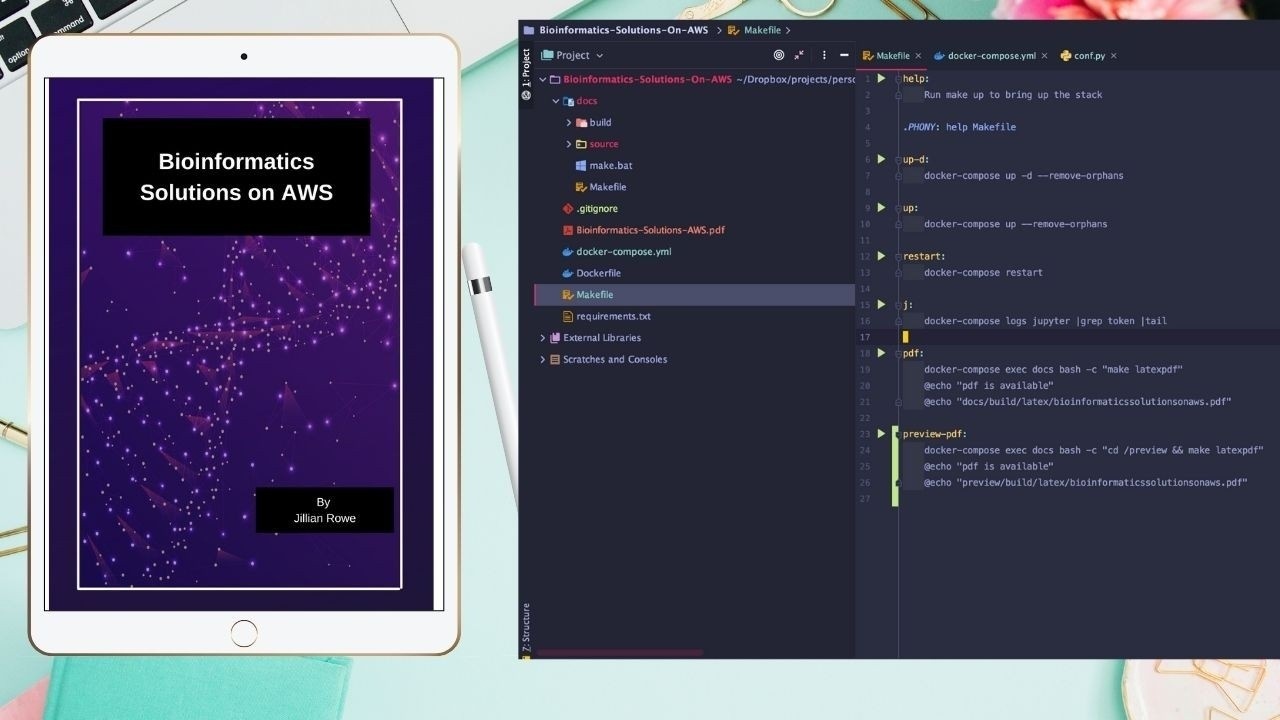
This is the introductory chapter to my new book, Bioinformatics Solutions on AWS.
(I am aware that the links surrounded by brackets don't work. This is meant to be a book, not a website, but I will use the power of find and sed in order to bend these pages to my will and I will make an update! ;-) )
Introduction
What this Book Is and Isn’t
This book is meant to give a bird’s eye view to Bioinformaticians and other Data Scientists who are curious about the world of cloud computing. Maybe you have been on an in house HPC and are interesting in bursting to the cloud, or maybe you’ve founded a startup that needs infrastructure.
This book will give you an idea of the services you need to start from the ground up, from storage and compute infrastructure, to what types of clusters to use for different analysis types. I hope this books gives you the resources you need to design and implement infrastructure on AWS that suits your needs. Of course, I can’t go over every single service offered by AWS. There are way too many of those, and I would never claim to be an expert in each. Instead, this book covers the service options I use most frequently, and lists alternatives that I am aware of.
This book is not a tutorial on how to specifically deploy any of the services I discuss here. Meaning, there is no code until we get to the case studies. No code. I tried writing code for deployment, and was out of date before I even finished the book. Incidentally, this lead to my spending entirely too much time pondering my career choices. Instead, at the end of each service I will link to several resources I have found extremely reputable for deploying and managing said service. You can find a long list of websites and resources at the end of the book in the References.
If you would like more technical tutorials I have quite a bit of those on my website. I also have a help desk, which is mostly for my clients, but there is quite a bit of content on there as well.
This book is also self edited and self published. There are certainly typos and probably mistakes. If you feel that I haven’t cited something or cited something incorrectly please shoot me an email at [email protected] and I will correct it.
Acknowledgements
There are truly too many people to thank. I’ve been very lucky in my career to have wonderful bosses, mentors, and coworkers along with fascinating projects. The scientific computing community at large is a open and welcoming environment, and overall they are a very fun bunch of people.
I would specifically like to thank the [Sphinx] project, which this book is written in. There are many other scientific libraries that use Sphinx as their documentation engine, so I feel that I am in good company. Images are either from their respective projects with the appropriate links, or created with LucidCharts.
Why?
Before we get into any more detail on AWS infrastructure solutions, let’s talk a bit about the underlying reasons should we care about any of these.
Briefly, the entire why here is because we care about good science. More and more in the present day good science also relies on good data management and computational infrastructure, and so here we are. At the end of the day what we all want is a successful Bioinformatics project, which we will refer to as a Virtual Lab. A virtual lab could be:
-
A new algorithm such as [BWA].
-
A new analysis pipeline such as those developed by [Samtools] or [GATK].
-
A new analysis software package such as [Seurat] or [CellProfiler].
-
A new data visualization application such as [Scanpy].
-
A new analysis pipeline or integration of several pipelines into a single press button solution that can be run by a workflow manager such as [Snakemake] or [ApacheAirflow].
-
Research insights from a new dataset that will use one or more of the above. Often the findings will be discovered using one or more analysis libraries, and the results will be presented using one or more data visualization applications.
A successful Bioinformatics project can be consumed by academic research labs, industry R&D hubs, or biotech startups.
Benefits
Now that we know what we are going for, we can work backwards to think of what are the pieces that need to be in place in order to get at our goals listed above. One piece of this puzzle is to have a well thought out and standardized computing infrastructure. There are, of course there are other pieces, such as well designed experiments, project management, but we’re only talking about compute infrastructure in this book.
-
Create a standardized compute environment that is accessible by multiple people, along with new team members.
-
Reduce lack of knowledge with churn. This is especially important in academic research where postdocs come and go.
-
Encourage best practices for data management.
-
Create Virtual Labs.
Virtual Labs

Whenever I think about Bioinformatics Infrastructure, I always think of it as serving a purpose. That purpose is to create a Virtual Lab. A Virtual Lab is the result of a successful Bioinformatics project and almost exclusively contains one or more of the following (broken up into several categories). We will go into more detail in each of these categories in the next section. In the next chapter we will demonstrate what each of these means in a real world context.
Data Storage and Access
-
Backed up, version controlled, annotated datasets
-
Standardized machine readable file formats
-
SOPs for data analysis
Let’s take a step back and ask why we should care about any of these. Mostly, we are future proofing our lives and making sure that when something does go wrong, because something always goes wrong, that we can recover from our mistakes. Let’s say I am a data scientist who is not fully caffeinated and I do an incorrect join on some datasets, and I accidently overwrite an existing dataset. If I have versioning enabled this is not a problem because I can simply revert to a previous state when I realize that my dataset doesn’t make any sense. Better yet, let’s say that I have a standardized machine readable format for my data. That data format will often have one or more baked in sanity checks, and when I try to write my dataset I may get an alert that all is not well in data wrangling land.
Also, if I have an SOP for data analysis and the creation of new datasets, the steps I took to create this erroneous dataset will be documented and understood to prevent future mistakes, and to verify that this is not a correct dataset and should be tossed.
Computing
-
Standardized development environments, software stacks
-
APIs for annotated datasets
I’m sure most people have run into problems with software stacks and conflicting versions at one point or another in their analysis career. I’ve even heard of months of time or work being lost because a team switched from one version of software to another mid analysis, which changed their findings enough to result in an artificial batch effect. At best, dealing with software stacks is an annoyance, but at worst it can result in poor or incorrect research.
Research and Community Outreach
-
APIs and frameworks for data analysis
-
Data Visualization applications
-
Use of standardized data formats, SOPs, and analysis libraries to allow for the sharing of data and analysis with data portals and collaborators.
Now, this is not to say that each projects needs each of these. Many successful projects excel in a single area, such as [BioConda] for software management, or [AnnData] for These are just the markers that have stood out to me the most when working on projects. This chapter is mostly about the science, and we will get into software management more in a later chapter.
When exploring an analysis it is nearly always preferable to have some existing framework for your data analysis, at least as a starting point. Sometimes these are generalized tools for manipulating data frames [Tidyverse] for R or [Pandas], [Numpy], [ScikitLearn] or [Jupyterhub] for Python. Sometimes these are entire programmatic analysis libraries such as [Seurat] for analyzing single cell data or [Plink] for whole genome analysis.
Data Science Community
I also want to make an additional quick point here. There has been a big push from the data science community to have sets of standardized tools that play nicely together and are a part of the same ecosystem. The [PyData] and [NumFocus] organizations have been instrumental in these efforts by supplying support and even funding. This also means, that generally speaking, if an analysis tool falls into the PyData ecosystem that it has a robust toolkit for data representation, storing in one or more machine readable formats, querying, mathematical and statistical operations, visualization, and more. None of this would by possible without the amazing data science community, which I am very grateful to have been a part of.
Successful Bioinformatics Projects in the Wild
We’ve talked a lot about the conceptual idea of a Virtual Lab. Now let’s talk about real projects. As a disclaimer, I am not directly involved with any of these projects, with the exception of one small shameless self promotion. These are simply projects I have used some part of, and I think are fairly widely known and applicable to anyone working in Bioinformatics.
I’m making an exception to my no code rule here for the purposes of illustration, but be aware that this is Bioinformatics, and that all libraries move quickly and introduce function changes regularly.
All credit for the code, examples, and visualization go the the authors of the libraries.
The gnomAD Browser from the Broad
The Genome Aggregation Database (gnomAD) is a resource developed by an international coalition of investigators, with the goal of aggregating and harmonizing both exome and genome sequencing data from a wide variety of large-scale sequencing projects, and making summary data available for the wider scientific community.
The gnomAD Browser from the Broad https://gnomad.broadinstitute.org/

Now, let’s break down the different components of a successful Virtual Lab we see here.
Data Storage and Access
If you to the gnomAD downloads page you will see a variety of datasets available in a variety of formats. Each dataset is several stored on Google Cloud with [GCS], AWS with [S3], and Azure as an Azure Data Storage. Both [S3] and [GCS] are object stores, which have build in versioning and programmatic access.
Additionally, each dataset is stored in 2 different machine readable formats, [VCF] and [Hail]. Each of these is a machine readable format, with specs and sanity checks and all the goodies we like to see in our data formats.
Data Analysis
The datasets can be read in directly from their cloud storage data formats and analyzed using [Hail]. For example, here is a code snippet I completely grabbed from the very informative blog post Intro to Hail written by Kumar Veerapen.
# read in dataset from a machine readable format on gcs
gnomad='gs://gnomad-public/release/3.0/ht/genomes/gnomad.genomes.r3.0.sites.ht'
gnomad_ht = hl.read_table(gnomad)
# analyze using an analysis API exposed by the Hail software
mt = mt.annotate_rows(gnomad=gnomad_ht[mt.locus, mt.alleles])
Reading and writing data to/from the Hail format will provide necessary sanity checks and create a structure to our datasets. This structure is then consumed by an API provided by the [Hail] software that provides functions for statistical analysis, annotations, plotting, and more. Many publically available datasets then go on to power the [gnomAD] browser, which is a resource that is used by many labs and research institutes.
Data Visualization
Hail includes a set of functions for creating data visualizations on top of a Python visualization library [Bokeh]. Here is another example from the excellent Intro to Hail blog post.
p = hl.plot.scatter(x=mt.sample_qc.dp_stats.mean,
                        y=mt.sample_qc.call_rate,
                        xlabel='Mean DP',
                        ylabel='Call Rate',
                        size=8)
show(p)
Which results in:

Image from https://blog.hail.is/introtohail/. All credit should go to the Hail project.
There is also the [gnomAD] browser, which is a data portal built from publically available datasets from the Human Genome Project ([HumanGenomeProject]) and stored with [Hail].
The Human Cell Atlas
About the Human Cell Atlas In London on 13 and 14 October, 2016, a collaborative community of world-leading scientists met and discussed how to build a Human Cell Atlas—a collection of maps that will describe and define the cellular basis of health and disease. Human Cell Atlas
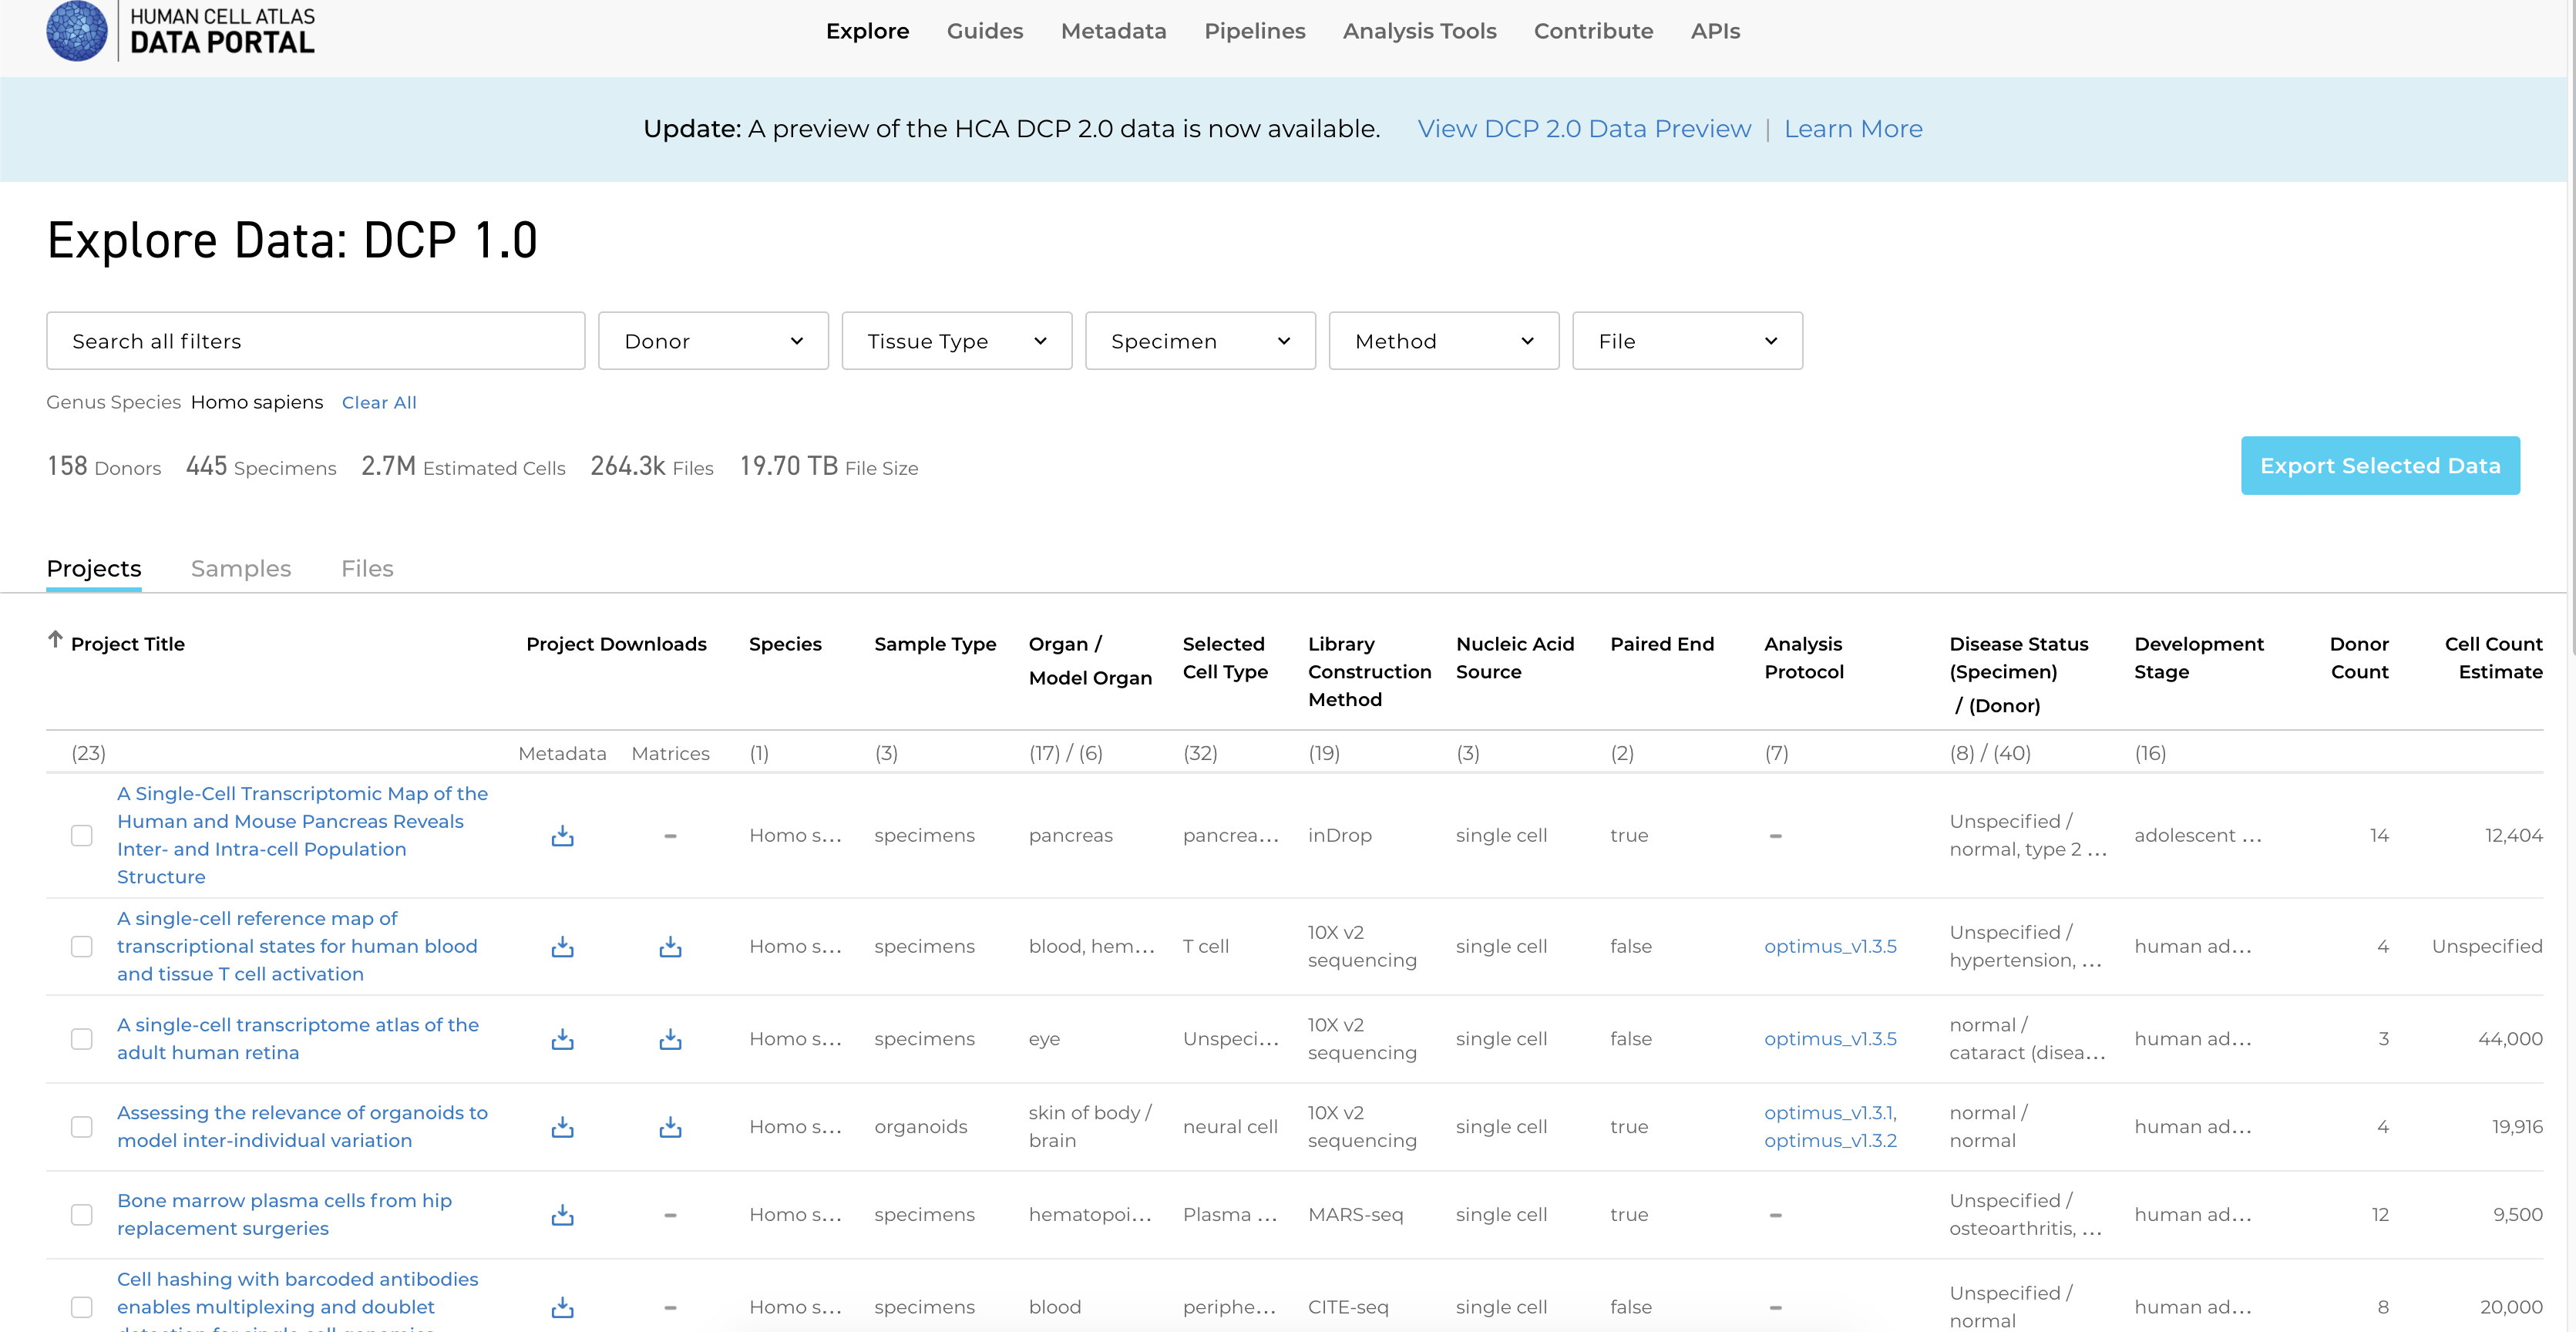
The Human Cell Atlas ([HumanCellAtlas]) is a truly cool project. It is less of a project and more of an ecosystem for best practices around Single Cell research. It hits what I consider to be all the spots of a truly successful data science project, from data access with machine readable formats, all the way up to interactive data visualization with a specialized cell browser.
Data Storage and Access
Much like we saw when dissecting the [gnomAD] browser and [Hail] software, we see a similar pattern here. Datasets are defined by a very particular data structure, which is managed by a software called [AnnData]. The data is stored in a machine readable format, [HDF5].
Here is an example from the Scanpy Tutorial.
adata = sc.read_10x_mtx(
'data/filtered_gene_bc_matrices/hg19/',  # the directory with the `.mtx` file
var_names='gene_symbols',                # use gene symbols for the variable names (variables-axis index)
cache=True)                              # write a cache file for faster subsequent reading
Analysis APIs
The single cell data is stored in a data format described by [AnnData] that is consumed by the analysis software [Scanpy]. Here is an example from Scanpy Tutorial showing how to get the genes with the highest expression in the dataset.
sc.pl.highest_expr_genes(adata, n_top=20, )
Here is another example showing how to use the [Scanpy] library to get a PCA plot from dataset.
sc.tl.pca(adata, svd_solver='arpack')
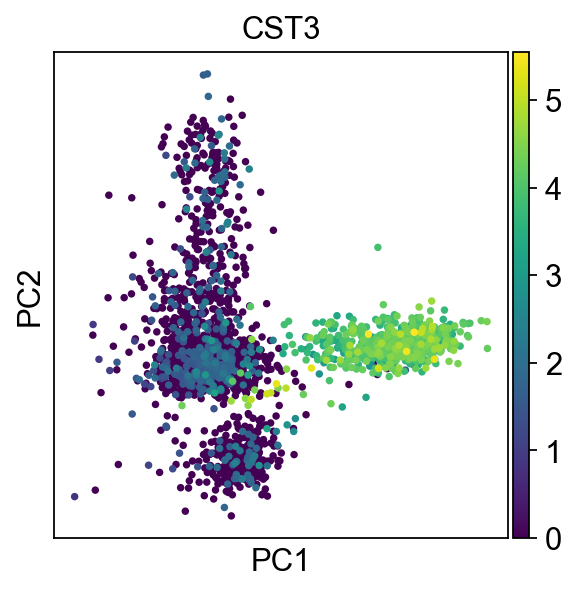
Image from the Scanpy Tutorial https://scanpy-tutorials.readthedocs.io/en/latest/pbmc3k.html`_
This brings us to an important point I briefly discussed earlier in the Why chapter. Although the data is formatted using a custom library, [AnnData], underneath the hood it is using libraries that are all a part of the [PyData] ecosystem such as [Numpy] for representing numeric and matrix data along with [Pandas] for more descriptive data. Since the data is written to [HDF5] it can be stored on a local filesystem or cloud object store such as [S3]. Much of the internal plotting demonstrated by the tutorial is done using wrappers around the data API and displayed using [Matplotlib].
Visualization
Once all the pieces are in place for data storage and data analysis some truly cool solutions start popping up. For the last few years I have become increasingly interested in real time data visualization of large datasets using scientific libraries and web servers. The CellxGene is an excellent example of that. It takes datasets managed with [AnnData] and analyzed with [Scanpy], and allows for real time data visualization and interactive analysis of data. You can read, write, cluster, and visualize your data all in a browser using [CellxGene].

Image from the CellxGene Data Portal - https://cellxgene.cziscience.com/e/01209dce-3575-4bed-b1df-129f57fbc031.cxg
Community
The Human Cell Atlas is very much a project with a heavy emphasis on community. It hosts data sets and analysis portals for hundreds of data sets, and allows for anyone to download any of their datasets and tools.
CellProfiler
[CellProfiler] is a Cell Image Analysis software that is especially interesting because it has really stood the test of time. It was started before many of the [PyData] libraries were available or standardized. They also have an excellent outreach program and put a heavy emphasis on designing their software for use by Biologists.
The team has done an incredible job lately of updating their libraries to conform with the latest from the [PyData] ecosystem, including using [Numpy] for it’s numeric data and integrating with the [ScikitLearn] library for much of it’s analysis and image processing. This included some very cool work to refactor their library to allow for the codebase to be used within the CellProfiler GUI, or by using [Jupyterhub] as a GUI to run analyses programatically. Previously, all work had to be done using their desktop application, and desktop applications do not always play nicely with large datasets or High Performance Compute Environments. All in all, this was a very cool move, and one I was very happy to see!
Data Storage and Access
The data fed into CellProfiler needs no particular format as it is cell data that is captured by a microscope and stored as an image. Analysis pipelines, however, can become quite complex and are stored as .cppipe files in [HDF5].
Data Analysis
I’m really going to break my no code rule, but it’s for a worthy cause. This code was adapted from the Cellprofiler Notebooks in the github repo and updated for the most recent version. Data is the same as that shown in the repo. To see the functions, including setting up the analysis functions, please see the demo notebook.
import cellprofiler
import cellprofiler_core
import cellprofiler_core.pipeline
from cellprofiler_core.preferences import set_headless
import cellprofiler_core.image
import cellprofiler_core.measurement
import cellprofiler.modules.maskimage
import cellprofiler_core.pipeline
import cellprofiler_core.workspace
###
# for the sake of brevity not all the analysis code is here
# ...
data_dir = os.path.join(os.getcwd(), "data")
images = {
    "OrigBlue": skimage.io.imread(os.path.join(data_dir, "images/01_POS002_D.TIF")),
    "OrigGreen": skimage.io.imread(os.path.join(data_dir, "images/01_POS002_F.TIF")),
    "OrigRed": skimage.io.imread(os.path.join(data_dir, "images/01_POS002_R.TIF"))
}
pipeline_filename = os.path.join(data_dir , "ExampleFly.cppipe")
# Run the analysis!
workspace = run_pipeline(pipeline_filename, images)
# Get the "Nuclei" object measurements, as a pandas DataFrame
df = objects2df(workspace.measurements, "Nuclei")
df.head()
Now, what we have here is the CellProfiler library, that gives us programmatic access to a set of analyses that are stored in [HDF5] files. From there, we can run the analyses, and use the library to various results as a [Pandas] dataframe. As a quick side note dataframes’s can be read to and from databases with simply the [Pandas] library using the to_sql package, which makes it an excellent choice for those that want to persist their data to a database. Because Cellprofiler plays nicely with the PyData ecosystem we get oodles of additional functionality, including all the statistics we can generate directly from a dataframe, a querying language, etc.

Additionally, because CellProfiler is using [ScikitLearn], we get all the functionality from that library, including the Sklearn Image library. We can view any image, using different channels and color formatting with the library.

Viewing [Pandas] data frames, [Numpy] data structures, and images are all very well supported within [Jupyterhub].
Wrap Up
This wraps up our examples of Bioinformatics projects out in the wild. There are, of course, many such projects that could be cited here. For the sake of not making this book an encyclopedia I have kept it to 3 examples. I hope you can see how important having each of your infrastructure pieces in place is to have a wildly successful project.
Buy The Book
If you'd like to buy the book head on over to my store . All my content is completely free for students, unemployed, those affected by COVID, and pretty much anyone that can't throw the expense on a company credit card. If any of those apply to you just send me an email at [email protected].
